In the investing world, one of the hardest truth is that 👉 Stock analysis is not easy, means that you will get a lot of trained monkey who called themselves as a stock expert but in reality they also make their statement without much analysis. But if you want to invest properly, make money and pick the better stocks then you need to put some hard work. Simply chasing anyone won’t work in long term.
The good news is that we can make this simple and today we are going to see some of the simple method that will – you a quick yes/no answer to which stock you should buy. In this article, we are going to see the 9 most important financial ratios which helps you to pick up the best stock.
📊 Why the Financial Ratios are so Important?
Just like the doctor assesses your health by checking your pulse, blood pressure and temperature, similarly an investors also assesses the financial health of any company just by checking these ratios. This will not just tell you which stock to but, but also when to exit when the bubbles pops. The biggest advantages of these ratios is that they gives quick signals. Now you don’t have to work for years, you can get the snapshot of company in just a minutes.
⚠️There is also one downside: These ratios can gives a false sense of security. The number may be look good but you have to still do the deeper analysis. Ratios is just the first pass, that protect you from the bad stocks.
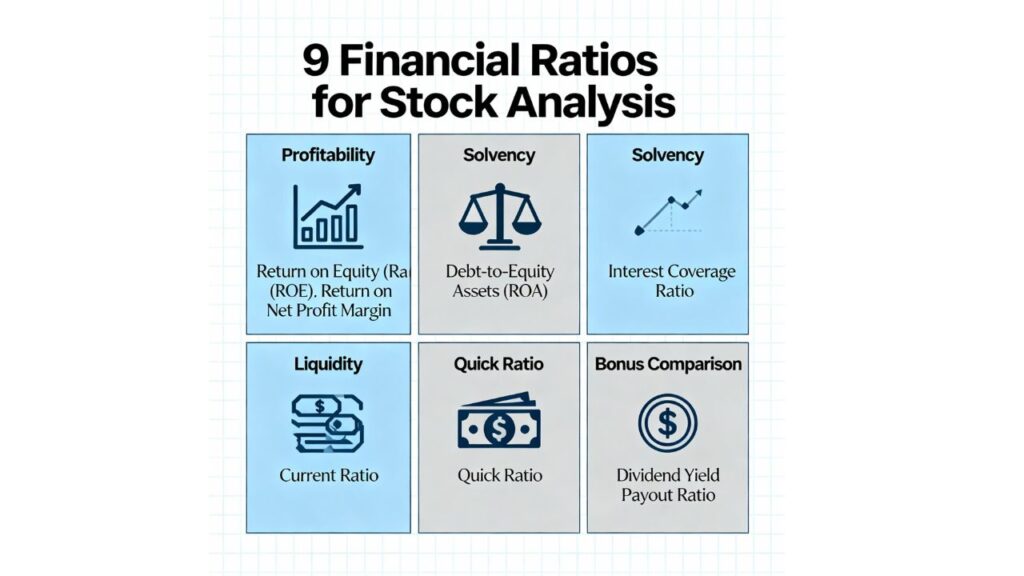
9 Financial Ratios You should know:
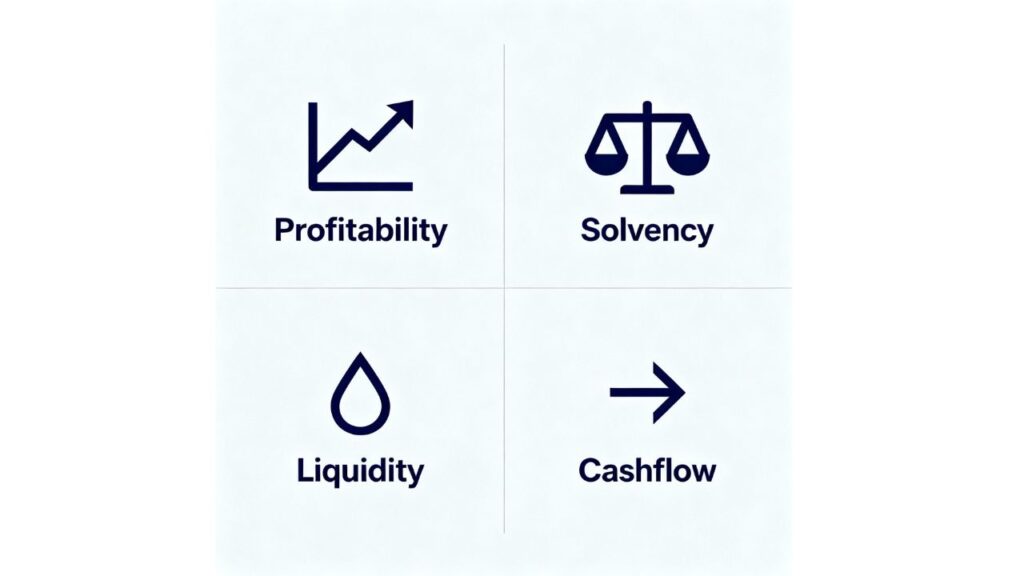
We divided the ratios in 3 categories: Profitability, Solvency, and Liquidity.
1. Profitability Ratios 💰
This ratio show how good management is working in converting the sales into the profits.
- Gross Margin: 📈 This ratio show how much money remain after the production costs and supplier payment. It reflects a company pricing power.
- Formula:
Gross Profit / Total Revenue
- Formula:
- Operating Margin: ❤️ This is one of the best! This shows that how much profit is left after controlling the operating expense (like staff, marketing).
- Formula:
Operating Income / Total Revenue
- Formula:
- Net Margin: 🎯 This buttons shows the earning. This is slightly different from operating margin because it includes taxes and interest on debt.
- Formula:
Net Income / Total Revenue
- Formula:
- Return on Equity (ROE): 💰 This ratio shows that how the management is converting investor’s money into the profit.
- Formula:
Net Income / Average Shareholder's Equity
- Formula:
2. Solvency Ratios 🛡️
This ratio shows that how much the debt on the company and its ability to repay it. These are most crucial for the smaller companies.
- Debt to Equity Ratio: ⚖️ This figure shows that how much debt a company has used to finance its business.
- Formula:
Long-term Debt / Total Equity
- Formula:
- Interest Coverage: 🤝 This figure show that how easily company is paying its interest from the profit.
- Formula:
Operating Income / Interest Expense
- Formula:
3. Liquidity Ratios 💧
This ratios shows that how easily company is paying its short-term bills and liabilities.
- Current Ratio: ⏳ It measures the company ability to cover the short-term obligations.
- Formula:
Current Assets / Current Liabilities
- Formula:
- Cash Ratio: 💸 If the company is in trouble, then this ratio tells how many bills it can pay with the just ready cash.
- Formula:
Cash / Current Liabilities
- Formula:
4. Cash Flow Ratios (Bonus!) 💵
This ratios reveals whether management is fudging the number with the accounting tricks.
- Operating Cash Flow vs. Net Income: 💸📈 It is easy to increase the Net income, but not the cash flow. If the income growth rate significantly exceed the cash flow growth, then it could be a red flag.
⚔️ Head-to-Head Comparison: Palo Alto vs. CrowdStrike
Let’s see an example these ratios:
| Ratio | Palo Alto Networks | CrowdStrike Holdings |
| Gross Margin | 73% | 76% |
| Operating Margin | 13.5% | -4% |
| Net Margin | 12% | -4.4% |
| ROE | 17% | -6.5% |
| Debt to Equity | 99% | 57% |
| Current Ratio | 0.94x | 1.83x |
| Cash Ratio | 0.36x | 1.83x |
- Profitability: This clearly show that Palo Alto is more profitable. CrowdStrike is spending more on R&D and marketing to take the market share. So that’s why its profitability is negative.
- Solvency & Liquidity: CrowdStrike is less leveraged but it has better balance sheet health. And it is holding more cash.
- Earnings Quality: Palo Alto’s income growth (60%) is much higher than its cash flow growth (16%), which may be a warning sign. CrowdStrike has negative earning but it has good cash flow.
Conclusion: Palo Alto is more profitable, but CrowdStrike has better balance sheet health and also the quality of earning seems to be more consistent.
🧐 How to Use Ratios?
- Head-to-Head Matchups: Compare the industry within an industry (like Meta vs. Alphabet). comparison outside the industry have no meaning.
- Company’s Own History: Try to track the company action over time. This will helps you to identify the trends and management performance.
- Search the Red Flags: When the ratio look like slightly strange, then understand that something is wrong. This can help you to avoid the market crash.
🚀 Meta vs. Alphabet & Nvidia vs. AMD
- Meta vs. Alphabet: Meta is more profitable in each and every measure and is also generating more return on the investor’s money. Alphabet has lower leverage but has better earning consistency.
- Nvidia vs. AMD: The profitiability of Nvidia is quite high. It gross margin indicates that its chips are so good that customers are ready to pay any price. Nvidia ROE (141%) is outstanding and shows that how powerful this company is.

🎯 Final Thoughts
Nation, i know this is very useful but if you are not doing this analysis, then you are most probably doing gambling not the trading. Because the ratio is not just a piece of the puzzle, but one of the most important piece. These ratio not only tells you the best stocks, but also shows the red flags in those stock so that you don’t lose your money.
These ratios shows the story of each and every company. If you learn to read these number, then you don’t have to worry about your stocks.


Can I just say what a reduction to seek out somebody who really knows what theyre talking about on the internet. You undoubtedly know learn how to bring a problem to mild and make it important. More folks need to read this and perceive this aspect of the story. I cant imagine youre not more widespread since you definitely have the gift.
I do not even know how I ended up here, but I thought this post was good. I don’t know who you are but definitely you are going to a famous blogger if you are not already 😉 Cheers!